SeekSoulOnline Differential Enrichment Analysis Guide
Overview
What Is Differential Enrichment?
Differential Enrichment aims to identify genes that are significantly differentially expressed across cell populations or experimental conditions, and to determine whether those genes are enriched within particular functions or pathways. The workflow typically involves two steps:
- Differential Expression Analysis: discover genes with significant changes.
- Functional Enrichment Analysis: interpret the functional and pathway context of those genes.
NOTE
Differential Enrichment is a core step in single-cell interpretation. Configure groupings and thresholds with the underlying biology in mind.
Biological Significance
Differential Enrichment plays a vital role in single-cell studies because it helps you:
- Characterize cellular functions: identify cell-type-specific marker genes via differential expression to understand functional features across cell populations.
- Explore biological processes: reveal how biological processes shift under different states through enrichment analyses.
- Investigate disease mechanisms: compare healthy and disease conditions to pinpoint potential disease-associated pathways.
- Discover drug targets: find genes and pathways that respond to treatment, providing leads for therapeutic development.
Analytical Value
A Differential Enrichment workflow enables researchers to obtain:
- Cell-type marker gene lists for annotation and functional characterization.
- Knowledge of active biological pathways that illuminate cellular functional states.
- Candidate regulatory mechanisms to guide follow-up experiments.
- Biological hypotheses that support deeper functional validation.
Using the Module
Start an Analysis by Creating a Comparison Scheme
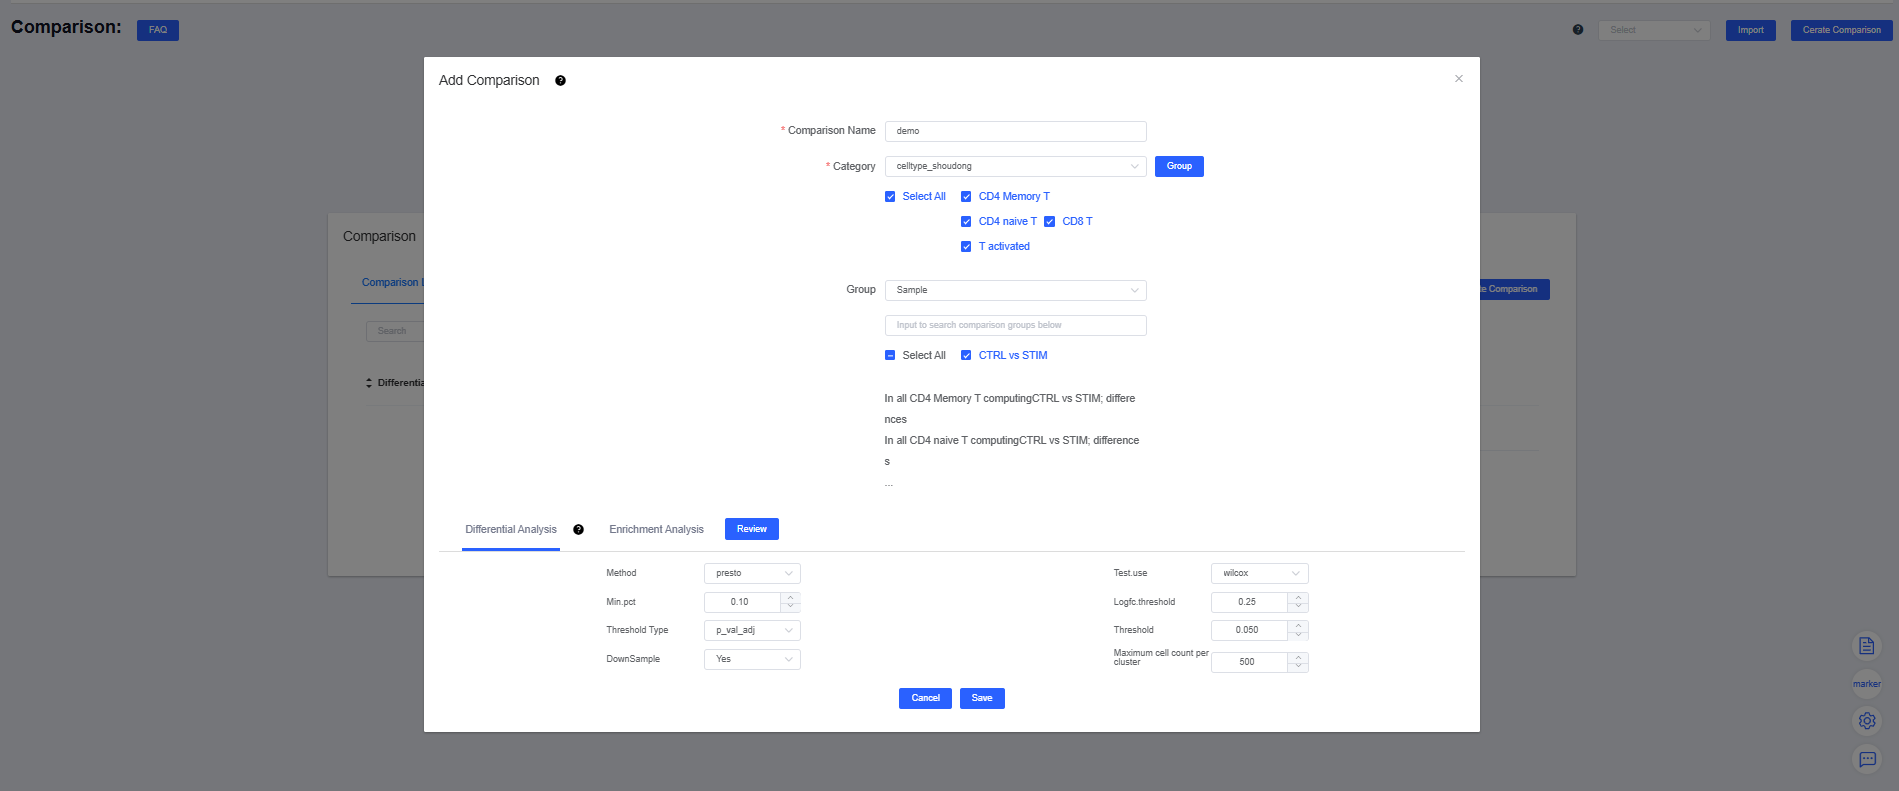
Click Create Comparison in the upper-right corner of the page to open the comparison dialog, then click Create Comparison again to create a scheme. The form includes three sections: Comparison Name, Category, and Group.
- Comparison Name: enter a name that clearly reflects the comparison so it is easy to distinguish and retrieve.
- Category: choose the objects you want to analyze—cluster labels, cell annotation labels, samples, or grouped sample labels (required). If no suitable label exists, click Group to create one; once saved, it appears in the dropdown.
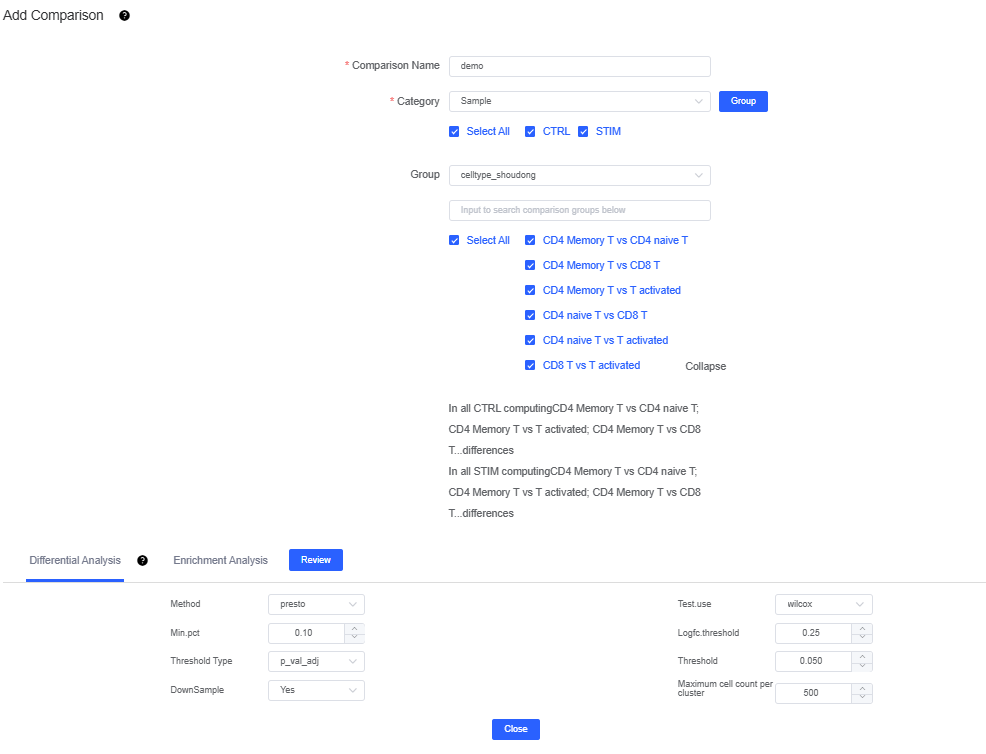
- Category: select the groups you want to compare—cluster or annotation labels, samples, or grouped sample labels (optional). If you configure more than five sets, click Expand to display them all (up to ten). The group before vs is the experimental (test) group, and the group after vs is the control; click vs to swap their order.
After defining the comparison scheme and configuring the Differential Analysis and Enrichment Analysis parameters, click Save to launch Differential Enrichment.
How to Interpret Comparison Name
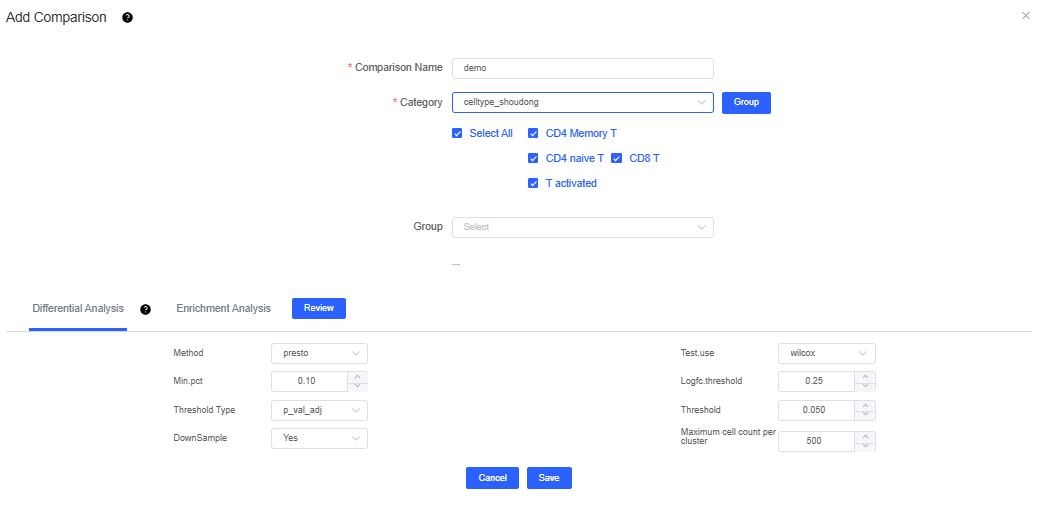
If Category uses cluster or annotation labels and Group uses samples or grouped sample labels, you compare the same cell type between two samples.
If Category uses samples or grouped sample labels and Group uses clusters or annotation labels, you compare two cell types within the same sample.
Selecting only Category (and leaving Comparison Sets empty) performs one-vs-many comparisons, where each group is contrasted with all other groups.
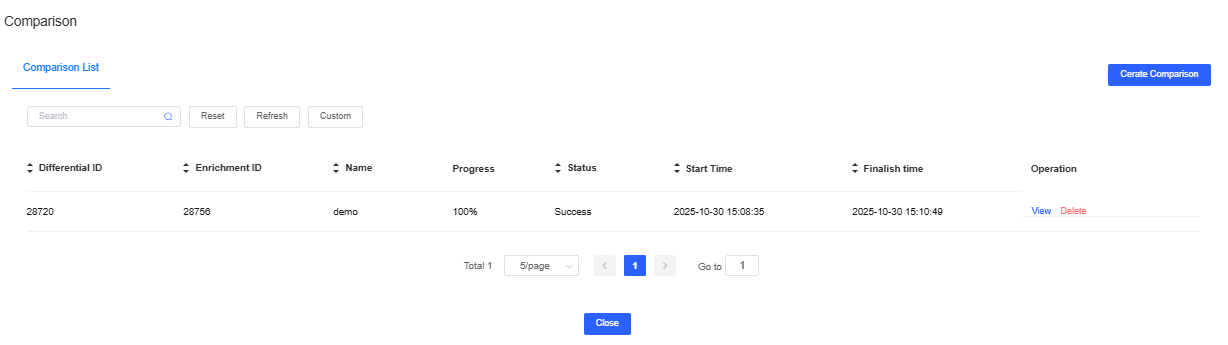
Edit or Delete a Comparison Name
The scheme list records all configurations. Click View to modify a scheme or Delete to remove it. When finished, click the background or Close (upper right) to return to the main interface.
Differential Expression Analysis
Methods
References: presto documentation, Seurat FindMarkers
| Software | Test | Core Principle | Advantages | Limitations | Recommended Scenarios |
|---|---|---|---|---|---|
| Presto | wilcox | Non-parametric Wilcoxon rank-sum (efficient implementation with auROC) | - Efficient for large cohorts - Memory friendly | - Requires downsampling for extreme sparsity/imbalance | Large datasets (≥1,000 cells/group); combine with downSample and maxCell |
| FindMarkers | wilcox | Non-parametric, compares medians and ranks | - Minimal distribution assumptions, robust | - Sensitive to severe imbalance/variance differences | Default option, broadly robust |
| FindMarkers | bimod | Log-normal likelihood-ratio test | - Matches log-normal expression patterns | - Sensitive to distribution assumptions | Near-continuous, log-normal expression |
| FindMarkers | roc | ROC/auROC separability analysis | - Intuitive separability metric | - No p-values; focuses on separability | Marker discovery and auxiliary evaluation |
| FindMarkers | t | Student’s t-test for mean differences | - Simple and fast | - Requires normality & equal variance; outlier sensitive | Approximate normal distributions, moderate sample size |
| FindMarkers | negbinom | Negative binomial test (counts, over-dispersion) | - Suitable for UMI counts/over-dispersed data | - Slower, parameter intensive | Raw counts with high dispersion |
| FindMarkers | poisson | Poisson test for sparse counts | - Straightforward sparse-count model | - Ignores over-dispersion | Sparse, Poisson-like data |
| FindMarkers | LR | Likelihood-ratio test (nested models) | - Supports covariates | - Requires careful modeling | When covariates must be modeled |
| FindMarkers | MAST | GLM accounting for zero inflation | - Tailored for zero-inflated single-cell data | - Computationally intensive | Heavy zero inflation and rigorous modeling |
Parameter Notes
- Min.pct: minimum fraction of cells expressing a gene (default 0.1, or 10%). Genes below this threshold in any group are excluded to speed up analysis.
- Logfc.threshold: absolute log2FC cutoff (default 0.25). Only genes with log2FC ≥ 0.25 or ≤ -0.25 are retained. Raising the cutoff accelerates analysis but may omit genes; the value must be > 0.
- Threshold Type(p_val / p_val_adj): threshold for declaring significance (default p_val_adj < 0.05). If too many genes pass, lower it (e.g., 0.01). Set to 1 to disable filtering. Valid range: [0, 1].
- DownSample: toggles cell subsampling (enabled by default) to reduce computation time.
- Maximum cell count per cluster: caps the number of cells per group. When DownSample is enabled, groups exceeding the cap are randomly subsampled; smaller groups use all cells.
Functional Enrichment Analysis
Methods
Reference: clusterProfiler documentation
| Method | Function | Core Idea | Input | Output / Visualization | Recommended Use |
|---|---|---|---|---|---|
| ORA (over-representation analysis) | clusterProfiler::enricher | Hypergeometric/Fisher test for over-represented terms | Differential gene list + TERM2GENE (GO/KEGG/Reactome/MSigDB) | Enrichment tables; DotPlot, BarPlot | When you already have a differential gene set and want top terms |
| GSEA (gene set enrichment analysis) | clusterProfiler::GSEA | ES/NES with permutations to assess coordinated changes | Ranked gene list (e.g., by avg_log2FC) + TERM2GENE | NES, p.adjust; ES curves; Dot/Bar plots | When signals are subtle or you want to avoid hard thresholds |
Databases and Datasets
- The system supports databases for 100+ species (human, mouse, rat, zebrafish, fruit fly, worm, cat, dog, cow, chicken, horse, rhesus monkey, pig, platypus, opossum, green anole, Xenopus, yeast, chimpanzee, and more). See My Databases for details.
- Choose databases and datasets according to species and study goals—for example, prefer GeneOntology for functional annotation and KEGG or Reactome for pathway analysis.
| Database | Available Datasets |
|---|---|
| GeneOntology | Molecular Function, Biological Process, Cellular Components |
| Pathway | KEGG |
| MSigDB | H (Hallmark), C1 (positional), C2 (curated), C3 (regulatory targets), C4 (computational), C5 (ontology), C6 (oncogenic), C7 (immunologic), C8 (cell types), H_C2_C5 (combined library) |
| Reactome | Reactome pathway library |
Parameter Notes
- pvalueCutoff: p-value threshold for enrichment significance (commonly < 0.05).
- qvalueCutoff: FDR threshold (commonly < 0.05; consider 0.01 for large datasets).
- minGSSize: minimum gene set size (default 10) to filter very small sets and reduce false positives.
- maxGSSize: maximum gene set size (default 500) to remove overly broad sets.
Interpreting the Results
Differential Expression Output
Top panel: the Group/Comparison selector is synchronized with the scheme dropdown. Click highlighted bars to jump to the corresponding details on the right.
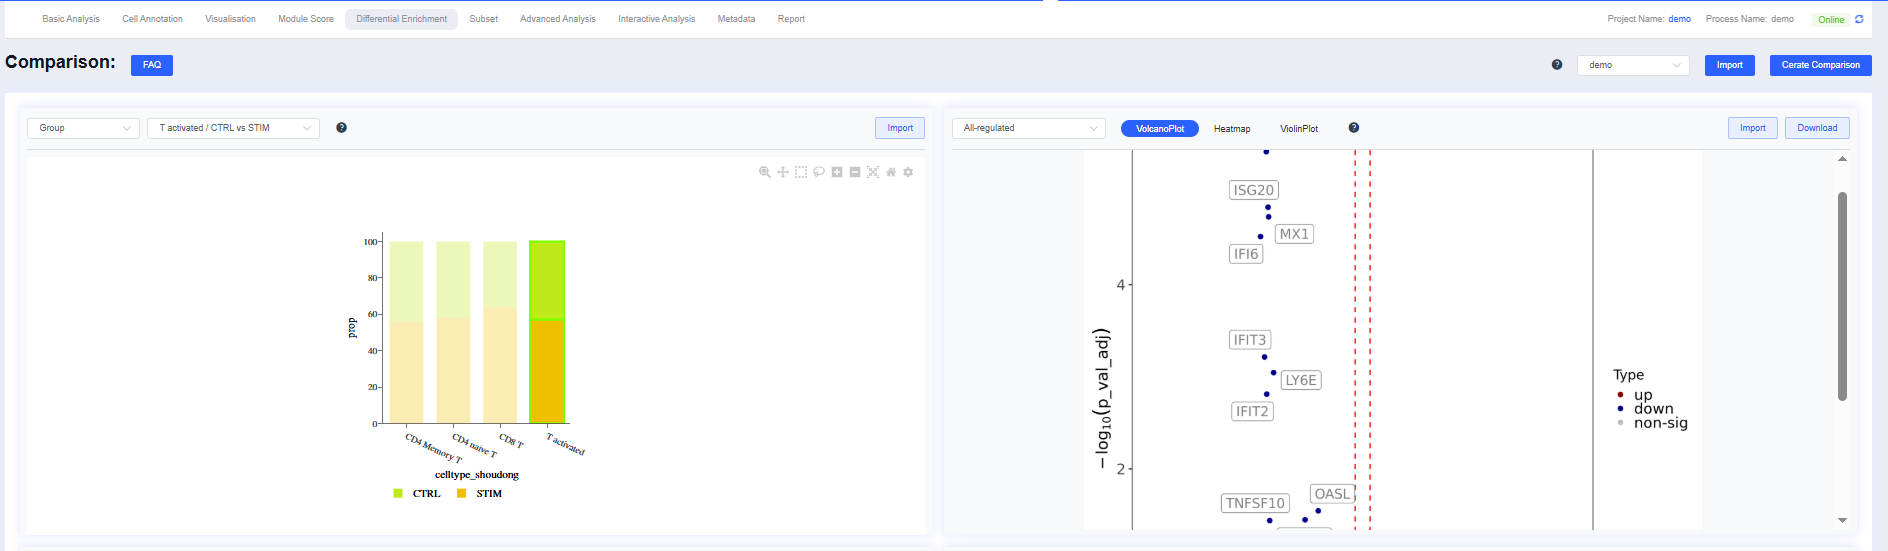
Volcano Plot
Volcano plots summarize differential expression results:
- X-axis: log2 fold change (log2FC)
- Y-axis: −log10(p-value)
- Colors:
- Red: significantly upregulated genes
- Blue: significantly downregulated genes
- Gray: non-significant genes
- Threshold lines: vertical dashed lines mark log2FC cutoffs; the horizontal dashed line marks the significance cutoff.
Heatmap
Heatmaps display how differential genes are expressed across groups:
- Rows: differentially expressed genes
- Columns: cell groups
- Colors: expression levels (red = high, blue = low)
- Clustering: hierarchical clustering for genes and cell groups
Violin Plot
Violin plots illustrate expression distributions by group:
- X-axis: cell groups
- Y-axis: expression level
- Shape: density of the distribution
- Boxplot overlay: median and interquartile statistics
Bottom panel: aggregated volcano and bubble plots that switch with the Group/Comparison perspective.
| View | Figures |
|---|---|
| Group | 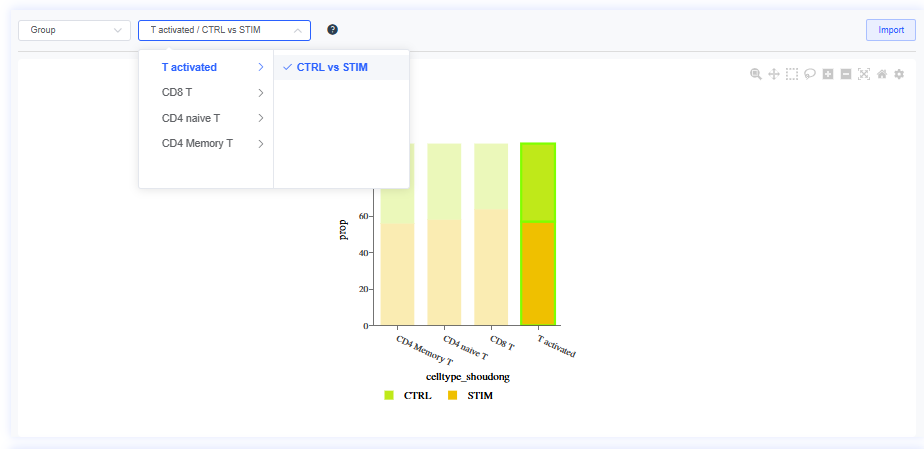 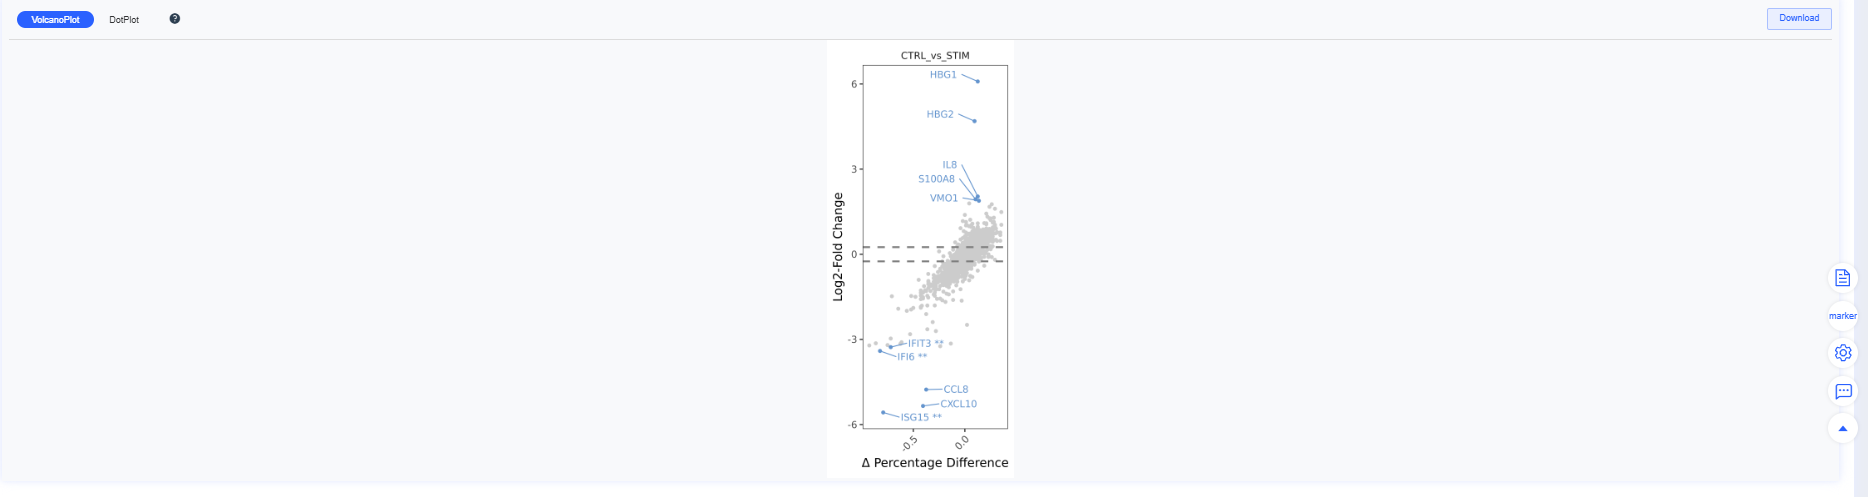 |
| Comparison | 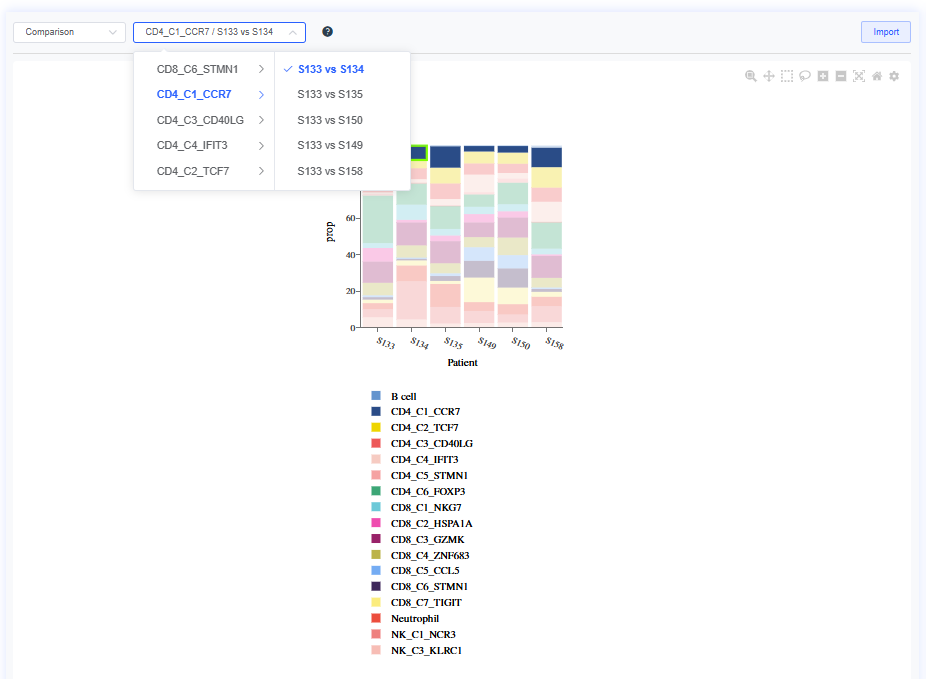 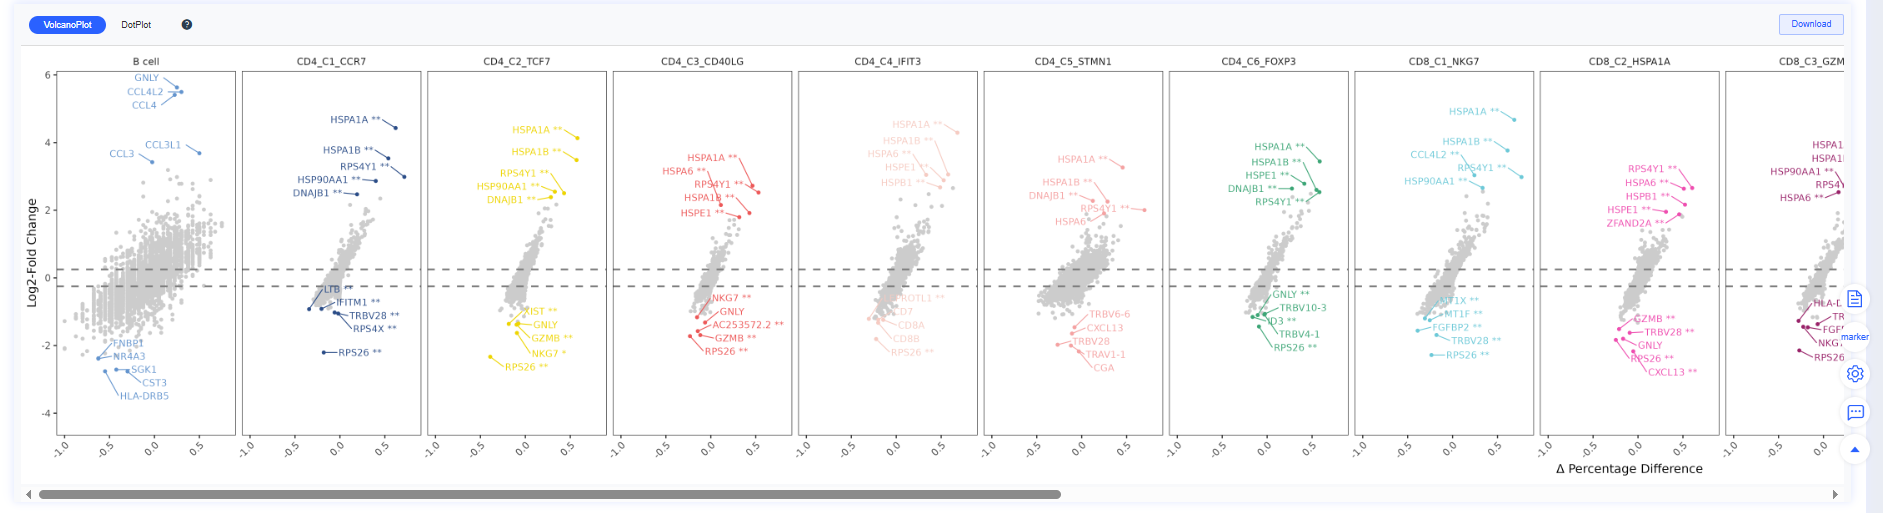 |
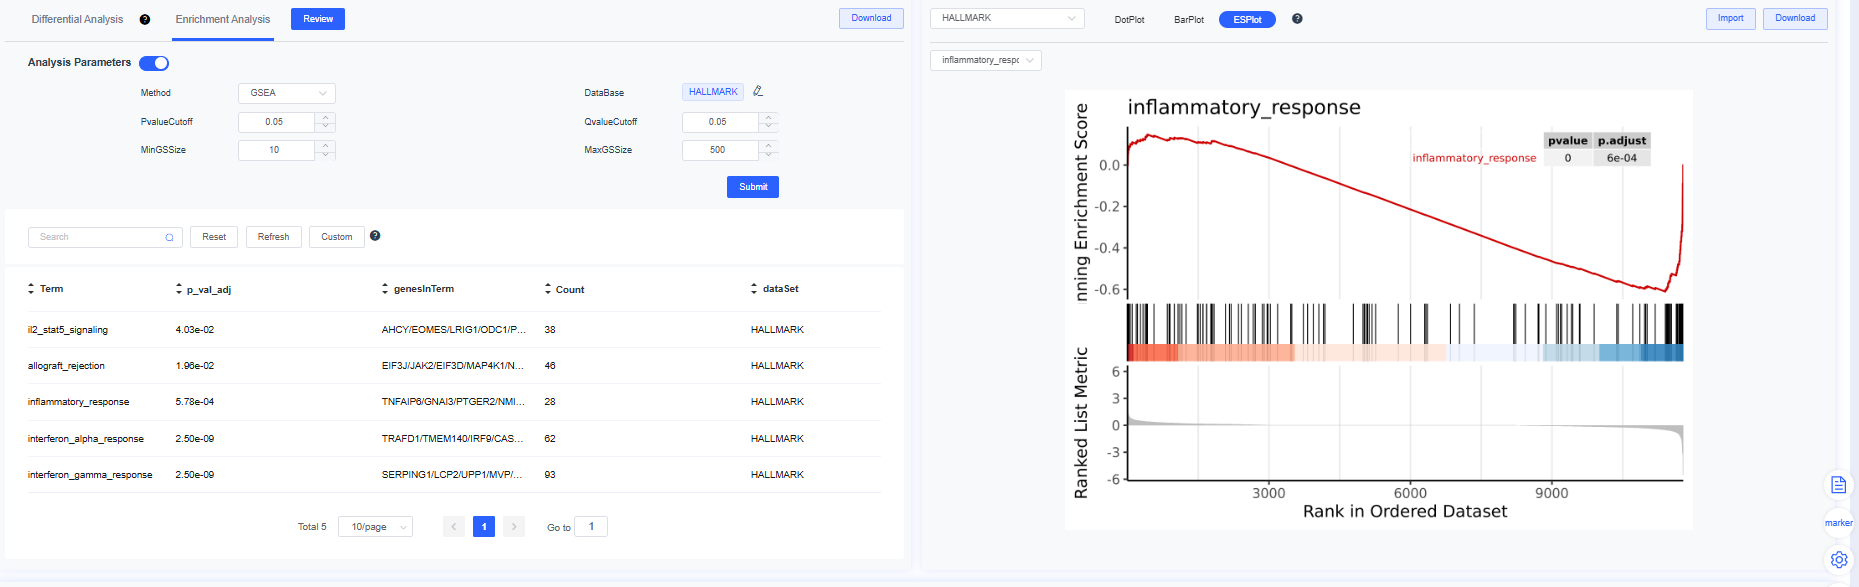
Enrichment Output
Middle panel:
- Left table: differential and enrichment results with search, filter, and sorting. Click Analysis Parameters to adjust methods or thresholds and rerun. Use Download to export differential or enrichment tables.
- Right plots: enrichment DotPlot, BarPlot, and ES curve based on the selected database and pathway focus.
DotPlot
- X-axis: GeneRatio
- Y-axis: pathway name
- Bubble size: number of enriched genes
- Color: significance
BarPlot
- X-axis: enrichment score or gene count
- Y-axis: pathway name
- Color: significance level
- Sorting: by enrichment magnitude or significance
GSEA Enrichment Score Plot
- X-axis: gene rank
- Y-axis: enrichment score
- Curve: enrichment score trajectory
- Vertical bars: positions of genes in the set
- Heatmap: gene expression levels
TIP
Differential Enrichment results can be further refined in the Plotting Tool for clearer interpretation and reporting.
Summary
The SeekSoulOnline Differential Enrichment module delivers an end-to-end workflow—from differential expression to functional enrichment—to help you interpret the biological significance of single-cell data. With well-chosen parameters and careful interpretation, you can obtain high-quality biological insights.
FAQ
Q1: How should I choose a differential analysis method?
- Default to Wilcoxon (FindMarkers: wilcox) for a robust, assumption-light option.
- Large cohorts (≥1,000 cells per group) or high performance needs: use Presto (efficient Wilcoxon/auROC).
- Over-dispersed counts: consider negbinom.
- Heavy zero inflation needing modeling: use MAST.
- Approximate normal distributions with moderate sample sizes: a t-test works.
- When covariates are required: select LR (likelihood ratio).
Q2: What if I obtain too many or too few differential genes?
- Too many: raise the logFC threshold (e.g., 0.25 → 0.5), increase min.pct (0.05 → 0.1), tighten p_val_adj (0.05 → 0.01).
- Too few: lower the logFC threshold, reduce min.pct, relax p_val_adj (0.05 → 0.1 or 1).
- Slow performance on large datasets: enable downSample and set max.cells.per.ident (e.g., 3,000–10,000).
Q3: Should I use p-values or adjusted p-values?
- Prefer adjusted p-values (p_val_adj ≤ 0.05); for multiple comparisons or large pathway sets, use stricter cutoffs (≤0.01).
- For exploratory analysis where filtering is undesirable, temporarily set the threshold to 1.
Q4: When should I use ORA versus GSEA?
- Use ORA (enricher) when you already have a differential gene set and want to focus on the most significant terms.
- Use GSEA when signals are subtle or you want to avoid hard thresholds.
- Database tips: use GO (BP/MF/CC) for functional annotation, KEGG/Reactome for pathways, or an MSigDB subset as needed.
Q5: What if the analysis runs slowly?
- Switch to Presto, enable downSample, and cap max.cells.per.ident.
- Narrow the database or pathway scope.
- Check whether the scheme contains too many comparisons; split them into batches if necessary.
Q6: How do I troubleshoot unexpected results?
- Verify that the Group/Comparison labels and directions are correct (the group before vs is the test group).
- Check whether subsampling introduced variability; rerun with adjusted thresholds.
- Consider batch or individual effects; adopt more robust methods or stricter thresholds if needed.
Q7: What if the enrichment database for my species is missing?
- SeekSoulOnline ships with hundreds of species libraries. Ensure the species setting is correct; if the database is missing, upload one manually. See My Databases for instructions.
TIP
Align parameters with the biological question, revisit Analysis Parameters to rerun and compare results, and interpret the tables alongside the provided visualizations.